Downloadable charts and summary maps include change in vessel traffic, historic ship tracks, spatial shipping trends, and an example of low impact shipping corridors. For additional downloadable maps please contact us.
Please feel free to use these maps for your presentations or reports. We request that you make appropriate acknowledgment to: uOttawa Environment, Society, and Policy Group (www.espg.ca).
Spatial Trends Communities
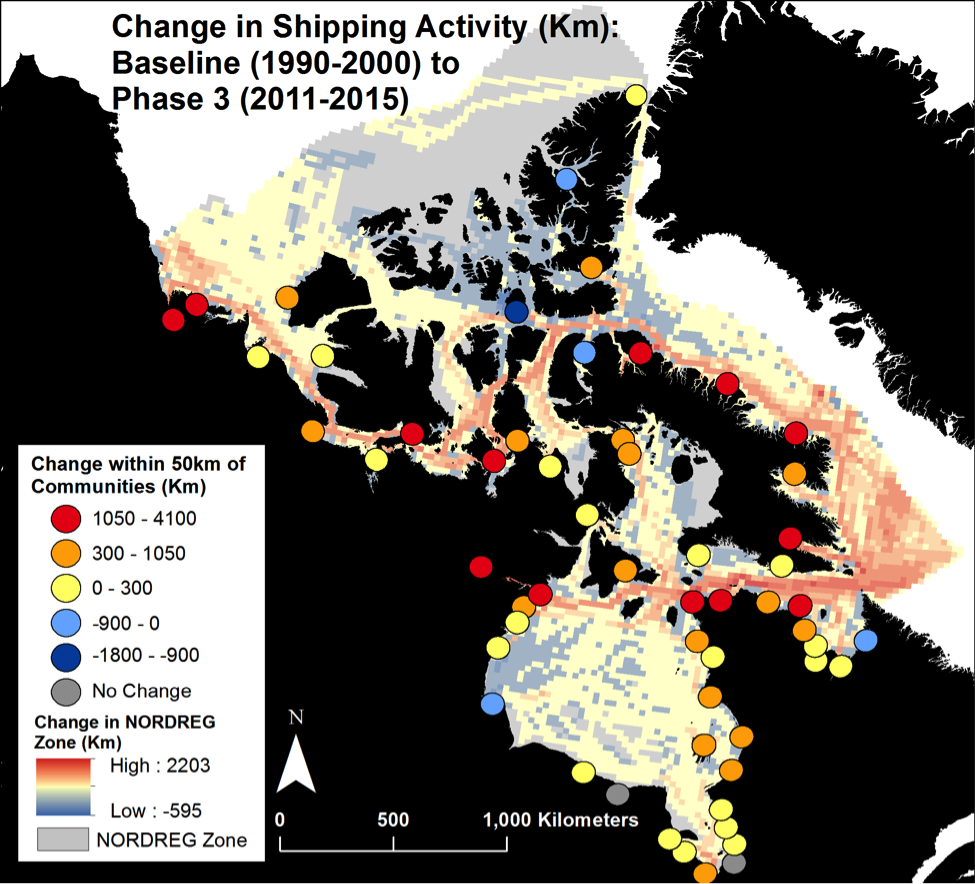
1. Change in vessel traffic (km travelled per year) between the baseline period (1990-2000) and Phase 3 (2011-1015).
Red dots represent communities with greatest increase in shipping traffic compared to the blue dots, whictively. (published in Dawson et al. 2017 in Arctic)
Spatial Trends by Vessel Type
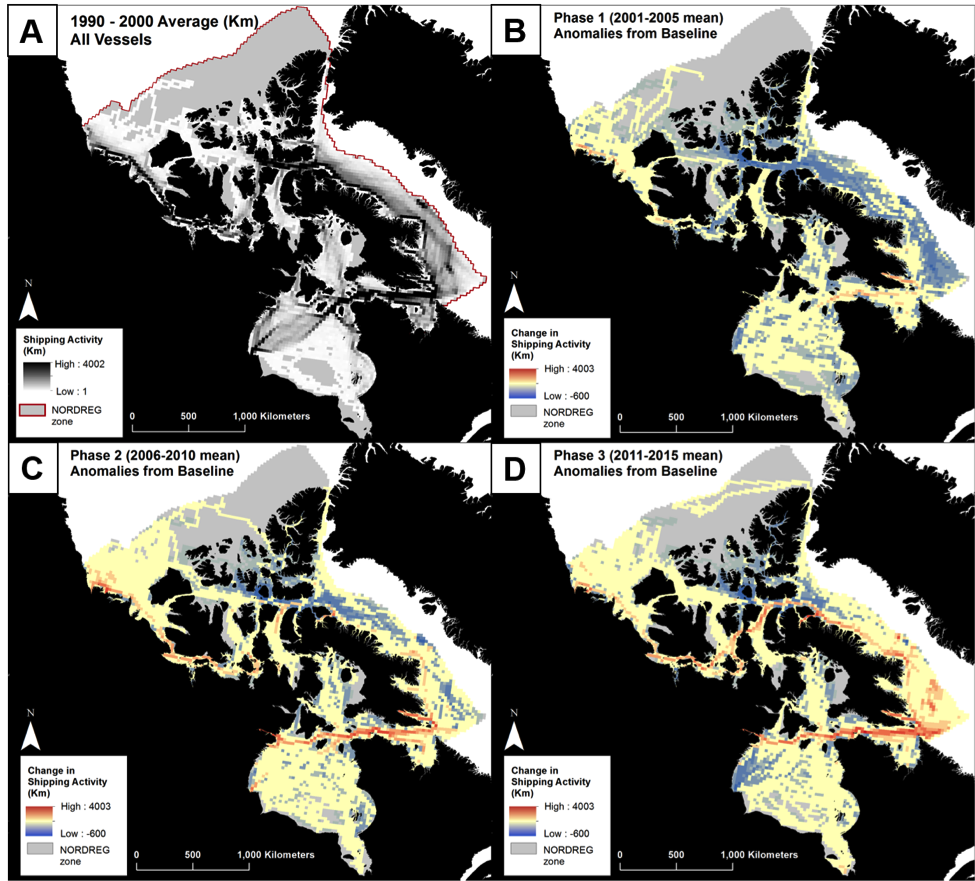
1. Annual km Travelled by All Vessel Types
(Baseline: 1990-2000) (A); Phase 1 (2001-2005 mean) Anomalies from Baseline (B); Phase 2 (2006-2010 mean) Anomalies from Baseline (C); Phase 3 (2011-2015 mean) Anomalies from Baseline (D). (Published in Dawson et al. 2017 in Arctic)
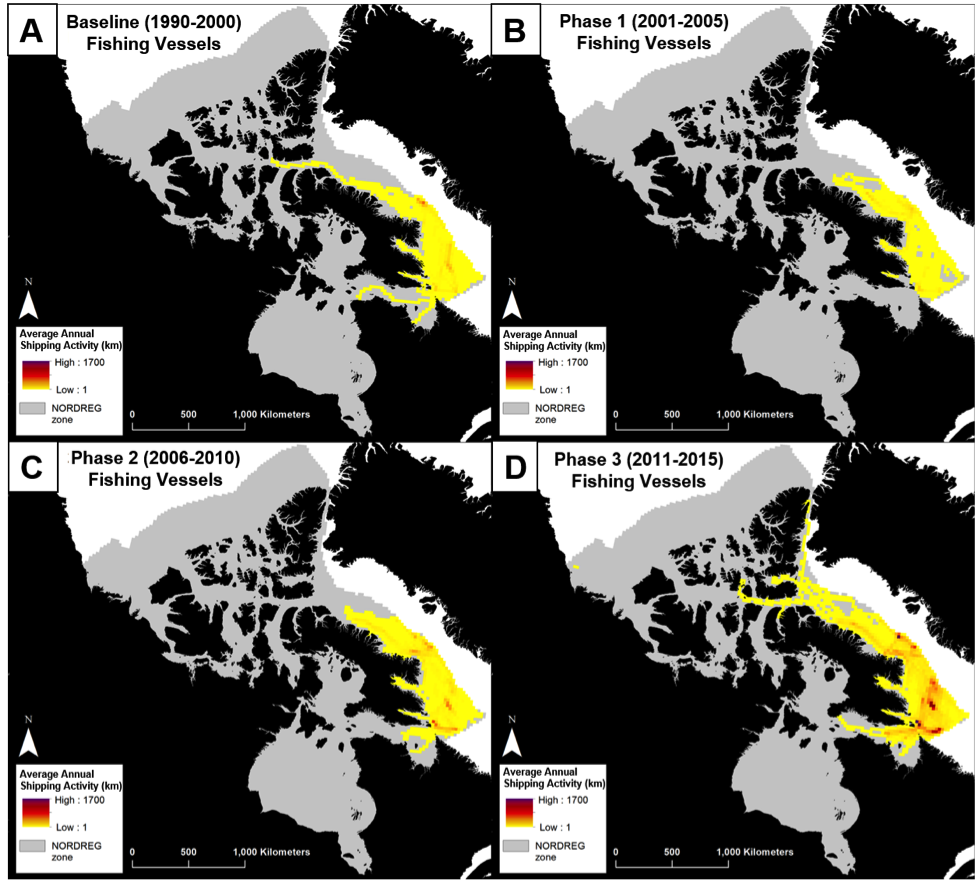
2. Annual km Travelled by Fishing Vessels
(Baseline: 1990-2000) (A); Phase 1 (2001-2005 mean) Anomalies from Baseline (B); Phase 2 (2006-2010 mean) Anomalies from Baseline (C); Phase 3 (2011-2015 mean) Anomalies from Baseline (D). (Published in Dawson et al. 2017 in Arctic)
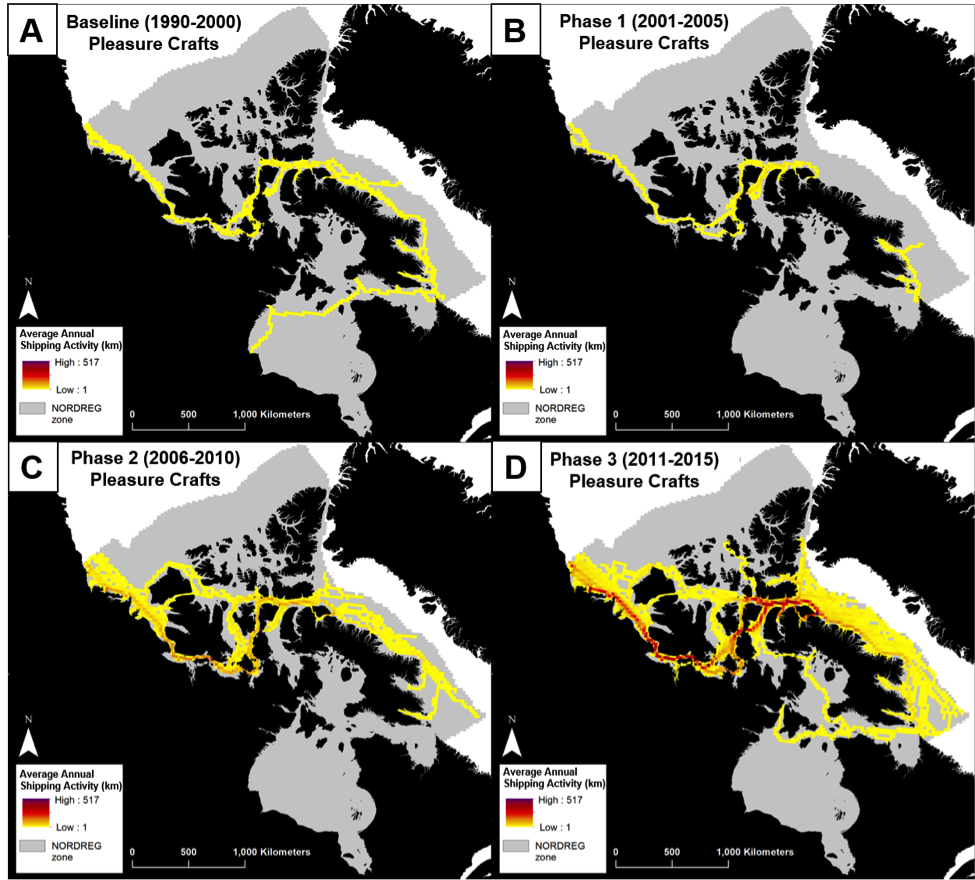
3. Annual km Travelled by Pleasure Craft
(Baseline: 1990-2000) (A); Phase 1 (2001-2005 mean) Anomalies from Baseline (B); Phase 2 (2006-2010 mean) Anomalies from Baseline (C); Phase 3 (2011-2015 mean) Anomalies from Baseline (D). (Published in Dawson et al. 2017 in Arctic)
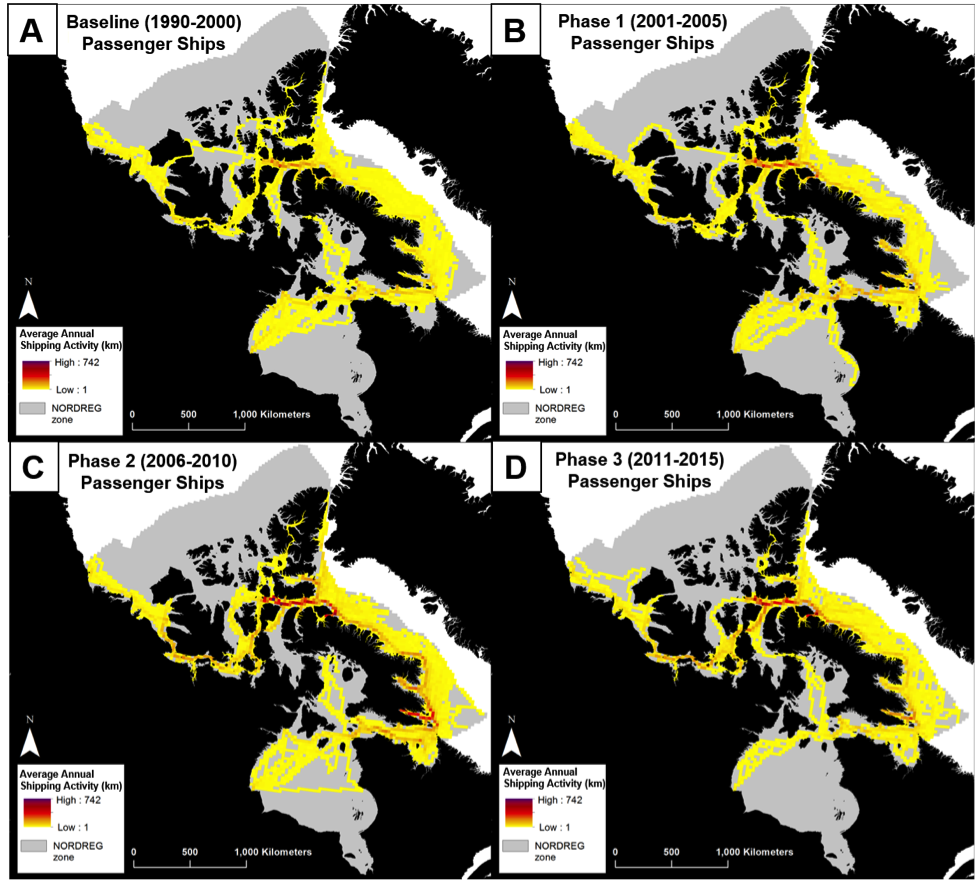
4. Annual km Travelled by Passenger Vessels
(Baseline: 1990-2000) (A); Phase 1 (2001-2005 mean) Anomalies from Baseline (B); Phase 2 (2006-2010 mean) Anomalies from Baseline (C); Phase 3 (2011-2015 mean) Anomalies from Baseline (D). (Published in Dawson et al. 2017 in Arctic)
5. Annual km Travelled by Bulk Carrier
(Baseline: 1990-2000) (A); Phase 1 (2001-2005 mean) Anomalies from Baseline (B); Phase 2 (2006-2010 mean) Anomalies from Baseline (C); Phase 3 (2011-2015 mean) Anomalies from Baseline (D). (Published in Dawson et al. 2017 in Arctic)
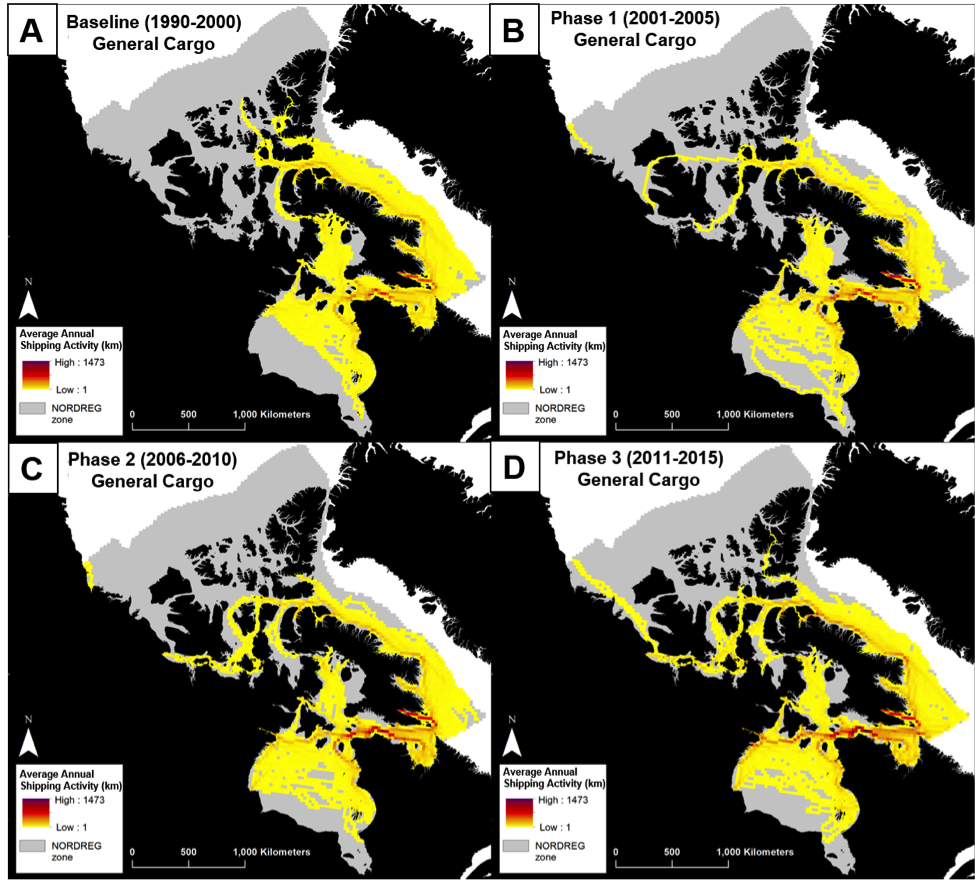
6. Annual km Travelled by Cargo Ship
(Baseline: 1990-2000) (A); Phase 1 (2001-2005 mean) Anomalies from Baseline (B); Phase 2 (2006-2010 mean) Anomalies from Baseline (C); Phase 3 (2011-2015 mean) Anomalies from Baseline (D). (Published in Dawson et al. 2017 in Arctic)
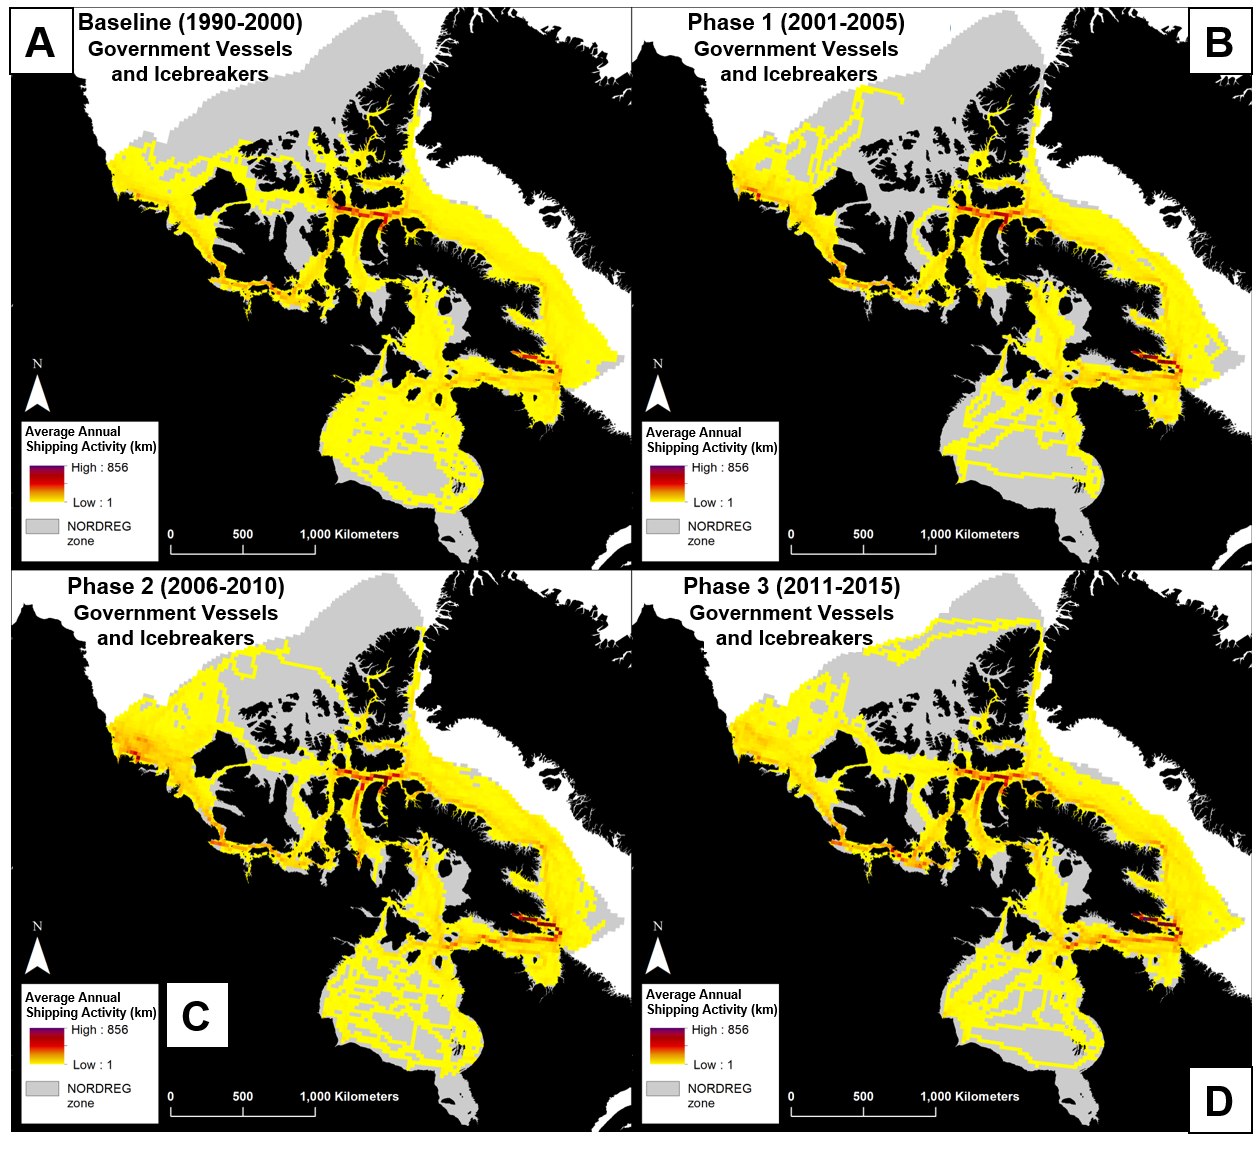
7. Annual km Travelled by Government Vessels (icebreakers)
(Baseline: 1990-2000) (A); Phase 1 (2001-2005 mean) Anomalies from Baseline (B); Phase 2 (2006-2010 mean) Anomalies from Baseline (C); Phase 3 (2011-2015 mean) Anomalies from Baseline (D). (Published in Dawson et al. 2017 in Arctic)
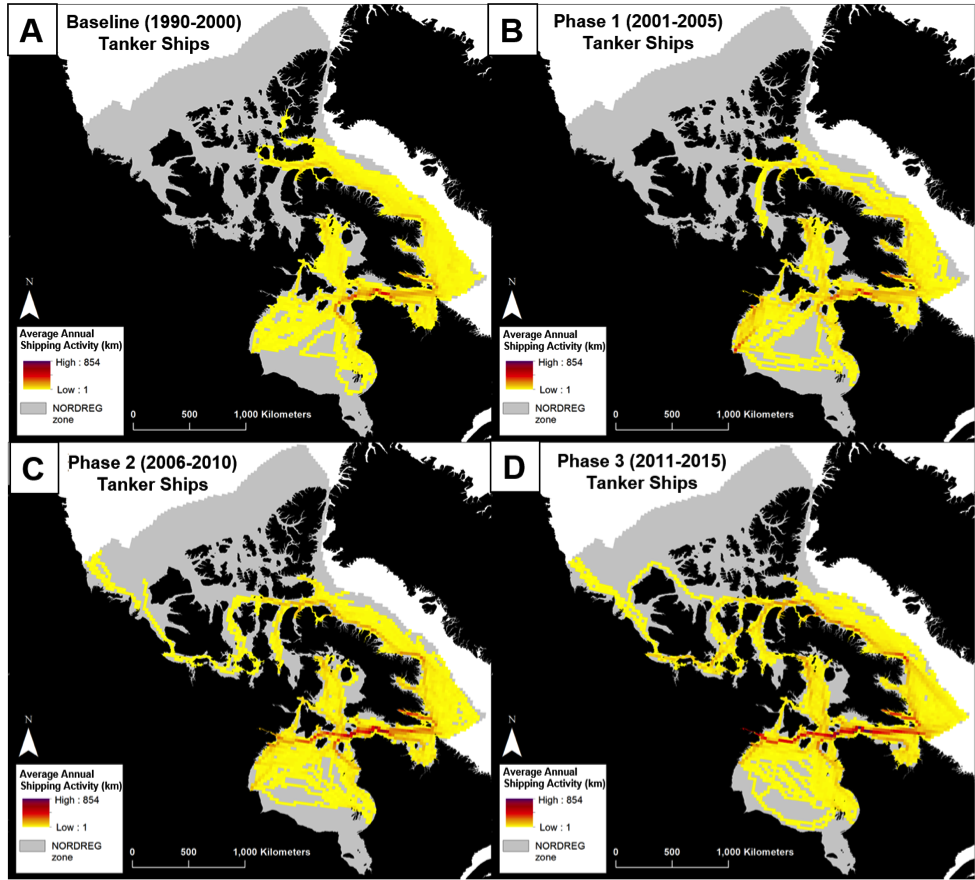
8. Annual km Travelled by Tankers
(Baseline: 1990-2000) (A); Phase 1 (2001-2005 mean) Anomalies from Baseline (B); Phase 2 (2006-2010 mean) Anomalies from Baseline (C); Phase 3 (2011-2015 mean) Anomalies from Baseline (D). (Published in Dawson et al. 2017 in Arctic)
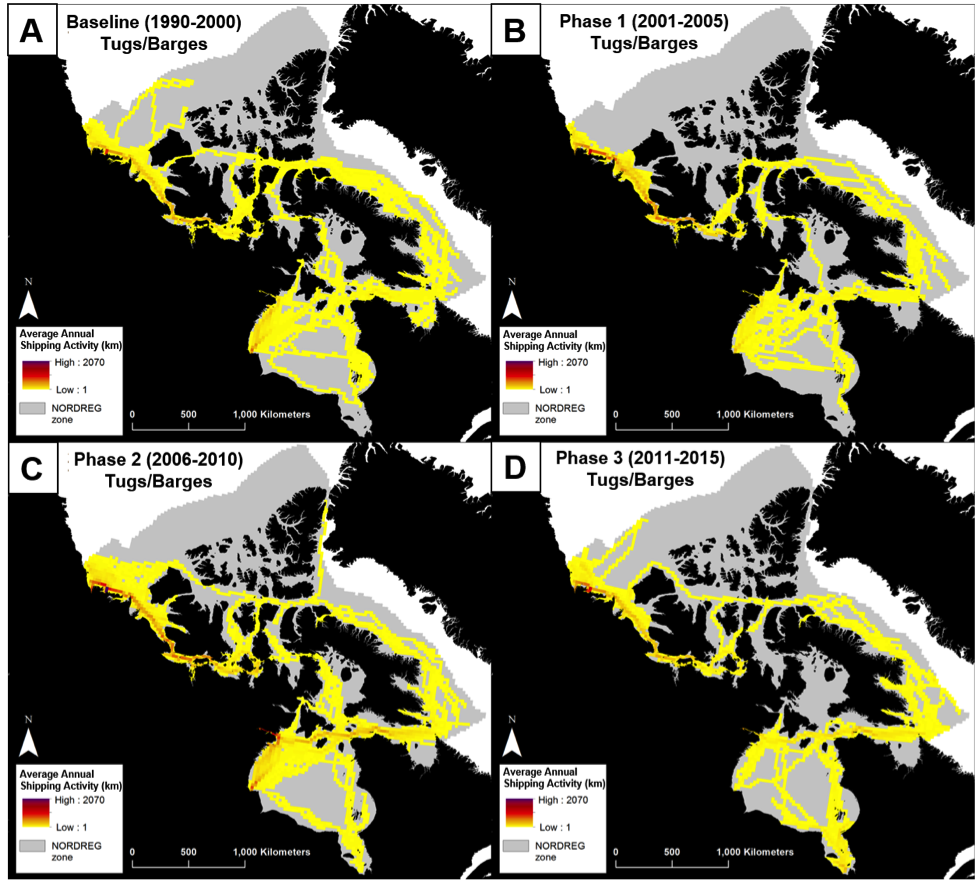
9. Annual km Travelled by Tug and Barge
(Baseline: 1990-2000) (A); Phase 1 (2001-2005 mean) Anomalies from Baseline (B); Phase 2 (2006-2010 mean) Anomalies from Baseline (C); Phase 3 (2011-2015 mean) Anomalies from Baseline (D). (Published in Dawson et al. 2017 in Arctic)
Additional Maps & Charts
1. Example of Low Impact Corridors
(The Pew Charitable Trusts, 2016)
The Low Impact Shipping Corridors will be a framework to guide future federal investments to support marine navigation safety in the North, including improved charting and increased hydrography, in partnership with Northerners
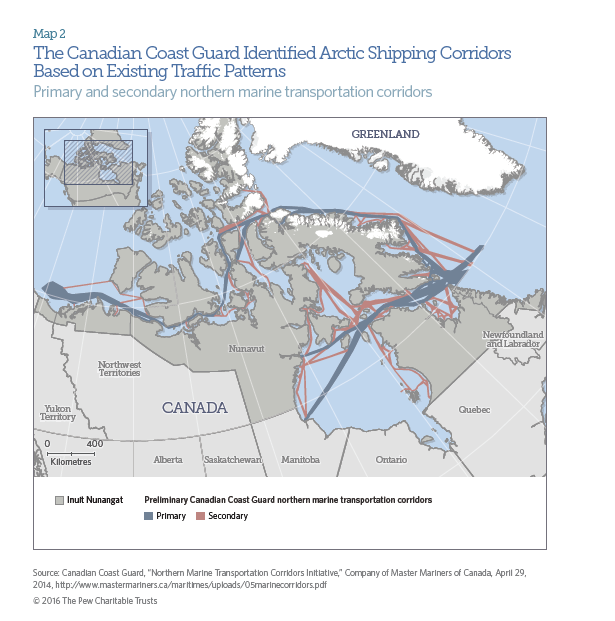
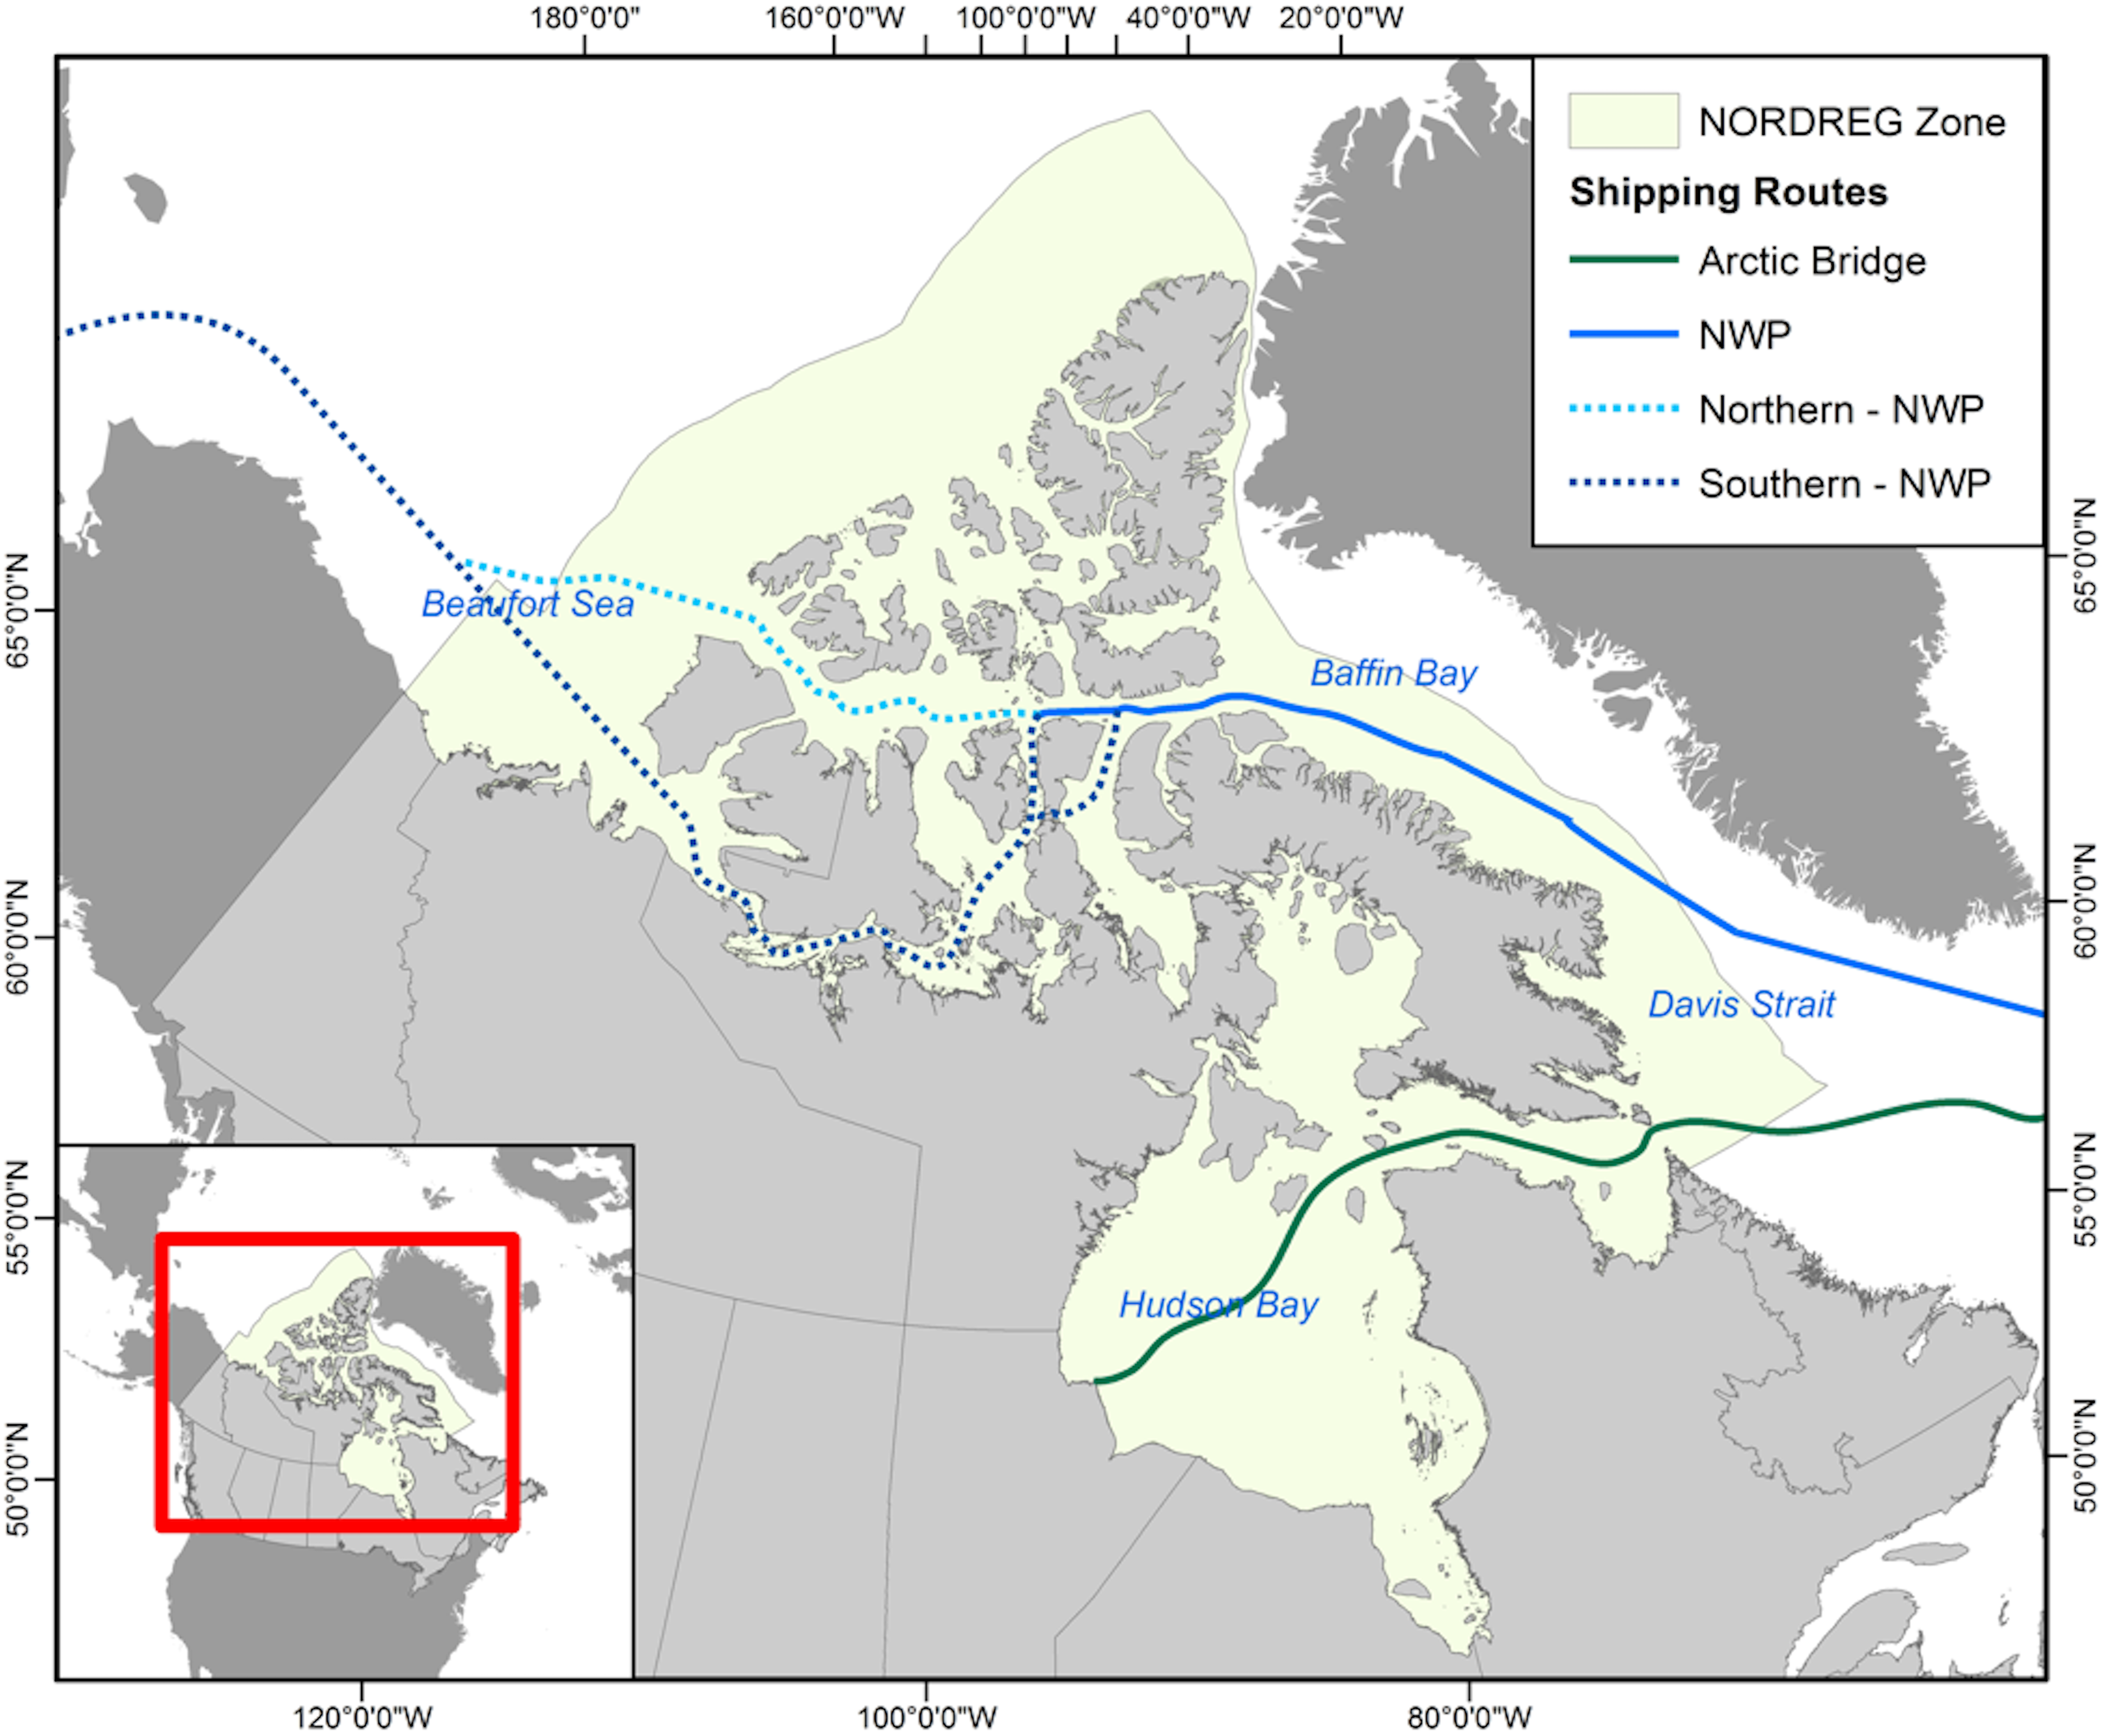
2. Map of Arctic Canada outlining major shipping routes:
Northwest Passage Northern (N-NWP) and southern (S-NWP), and Arctic Bridge (AB). (Published in Dawson et al. 2017 in Arctic)
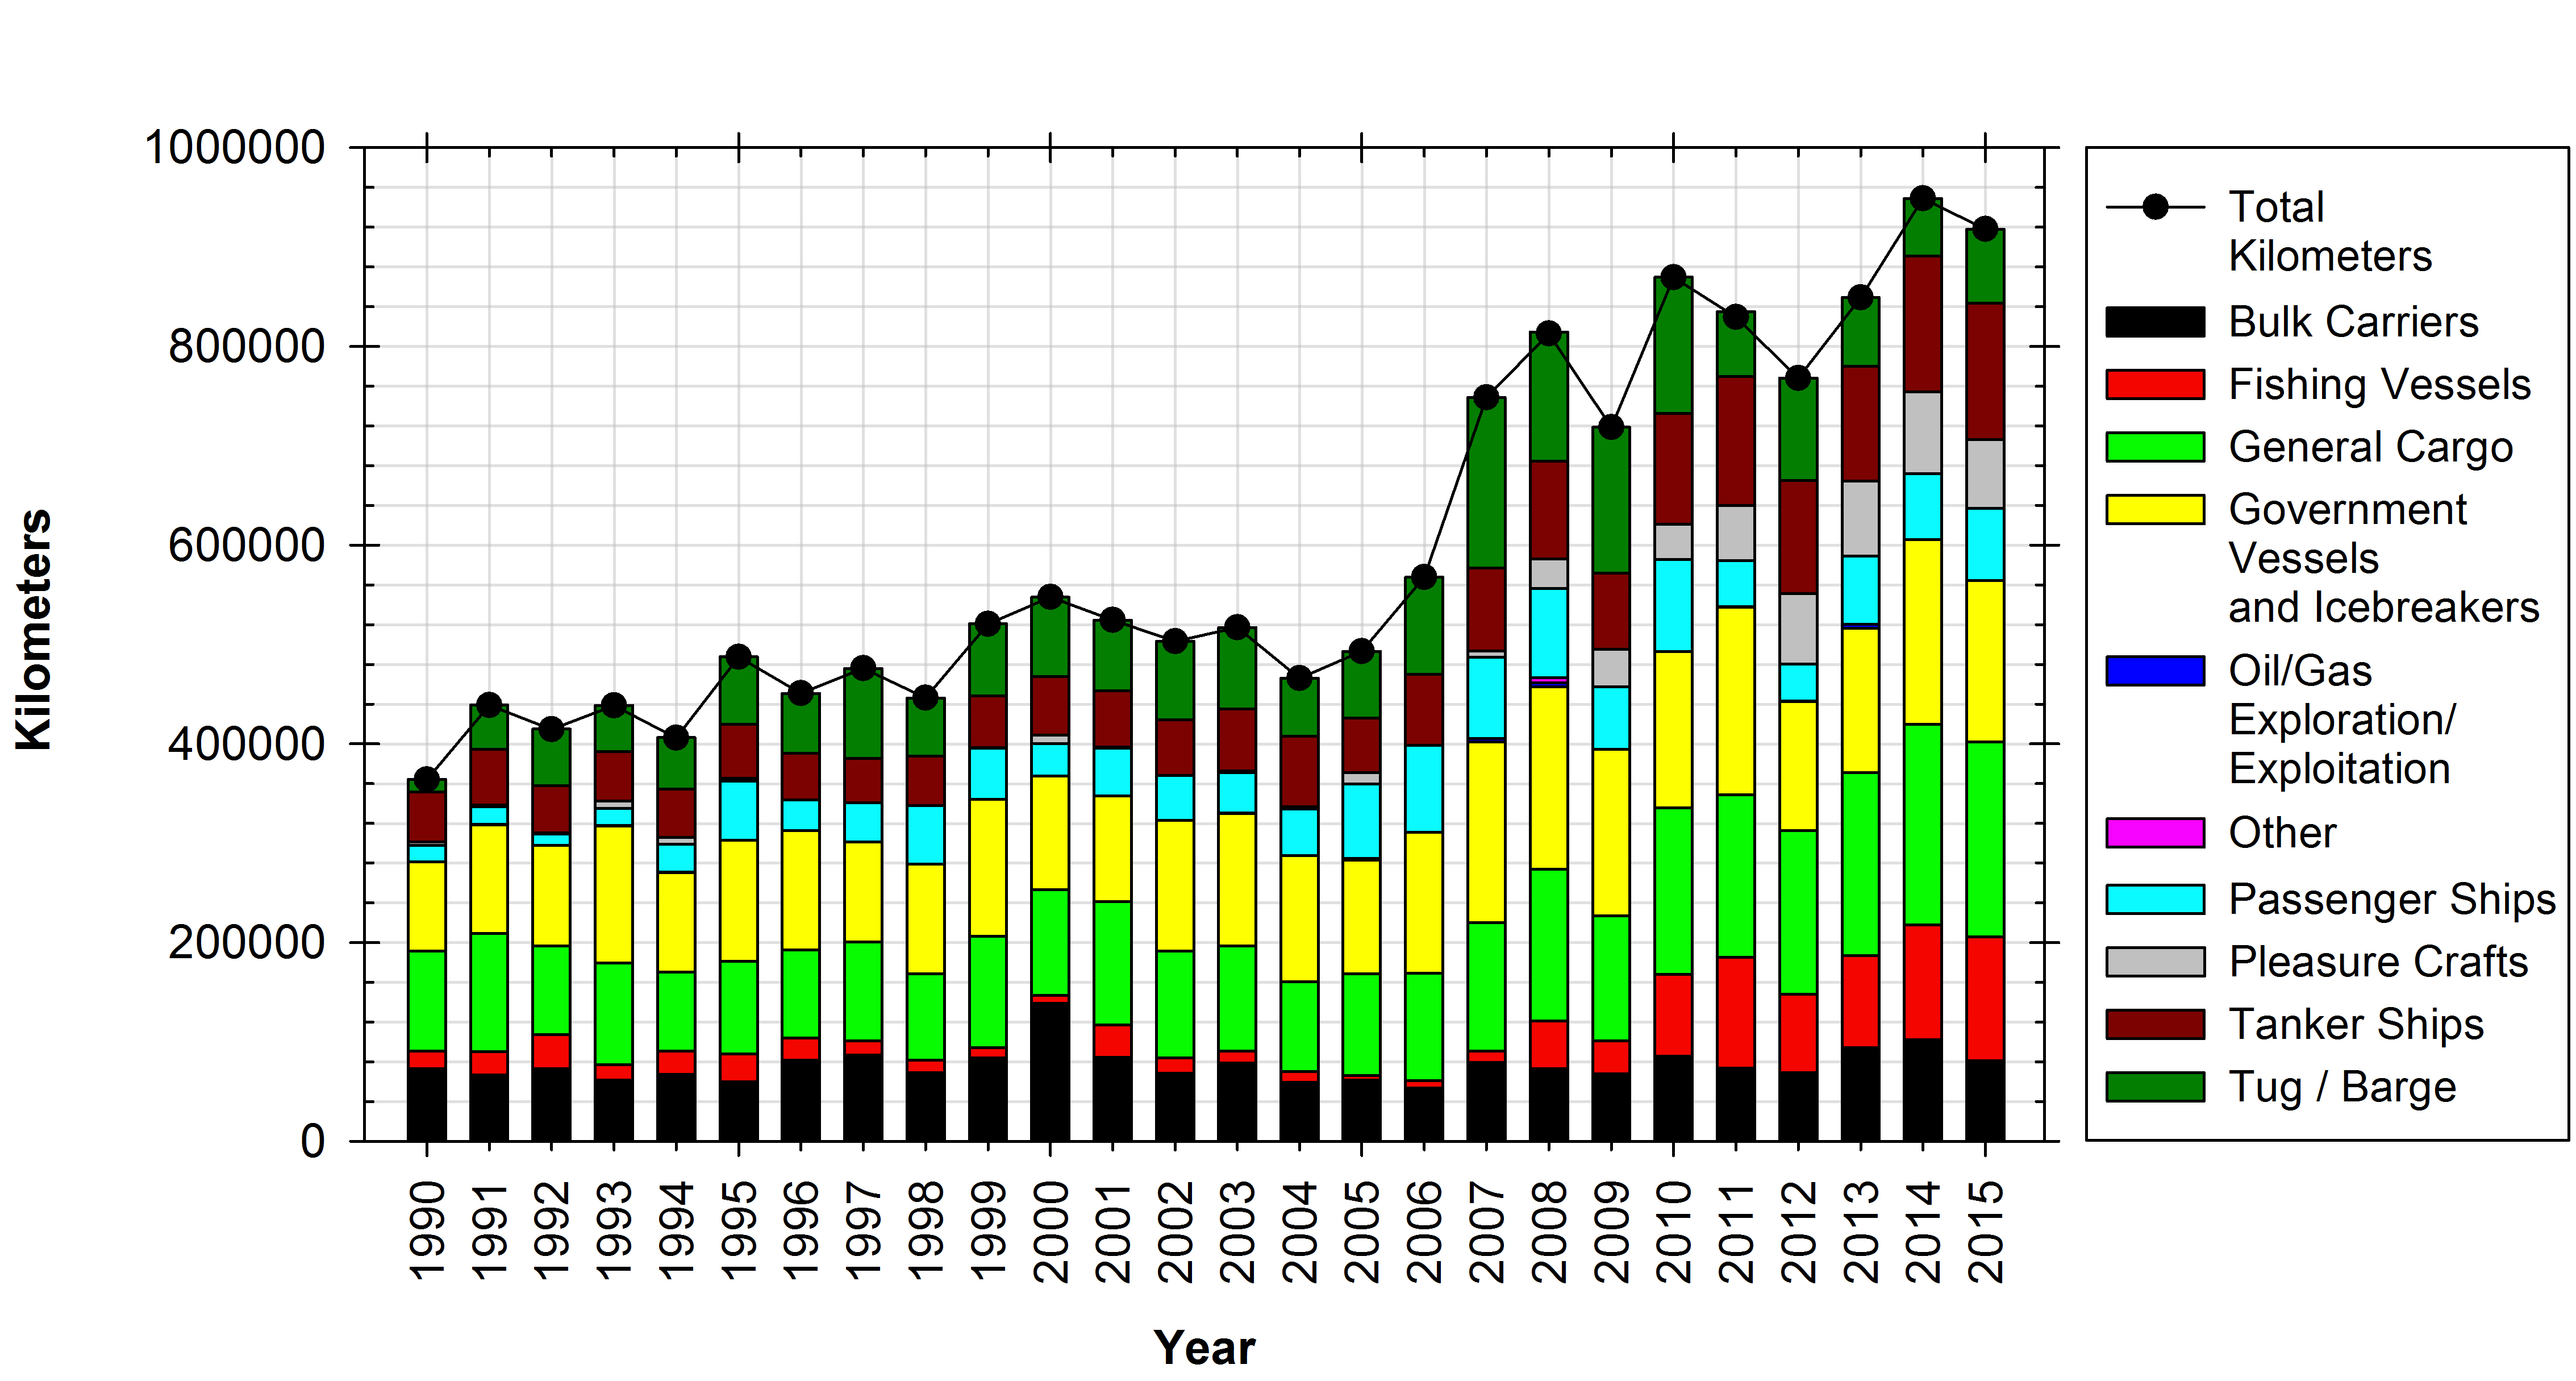
3. Annual travel by all vessel type
Total kilometres traveled annually by all vessel types in the Canadian Arctic. (Published in Dawson et al. 2017 in Arctic)
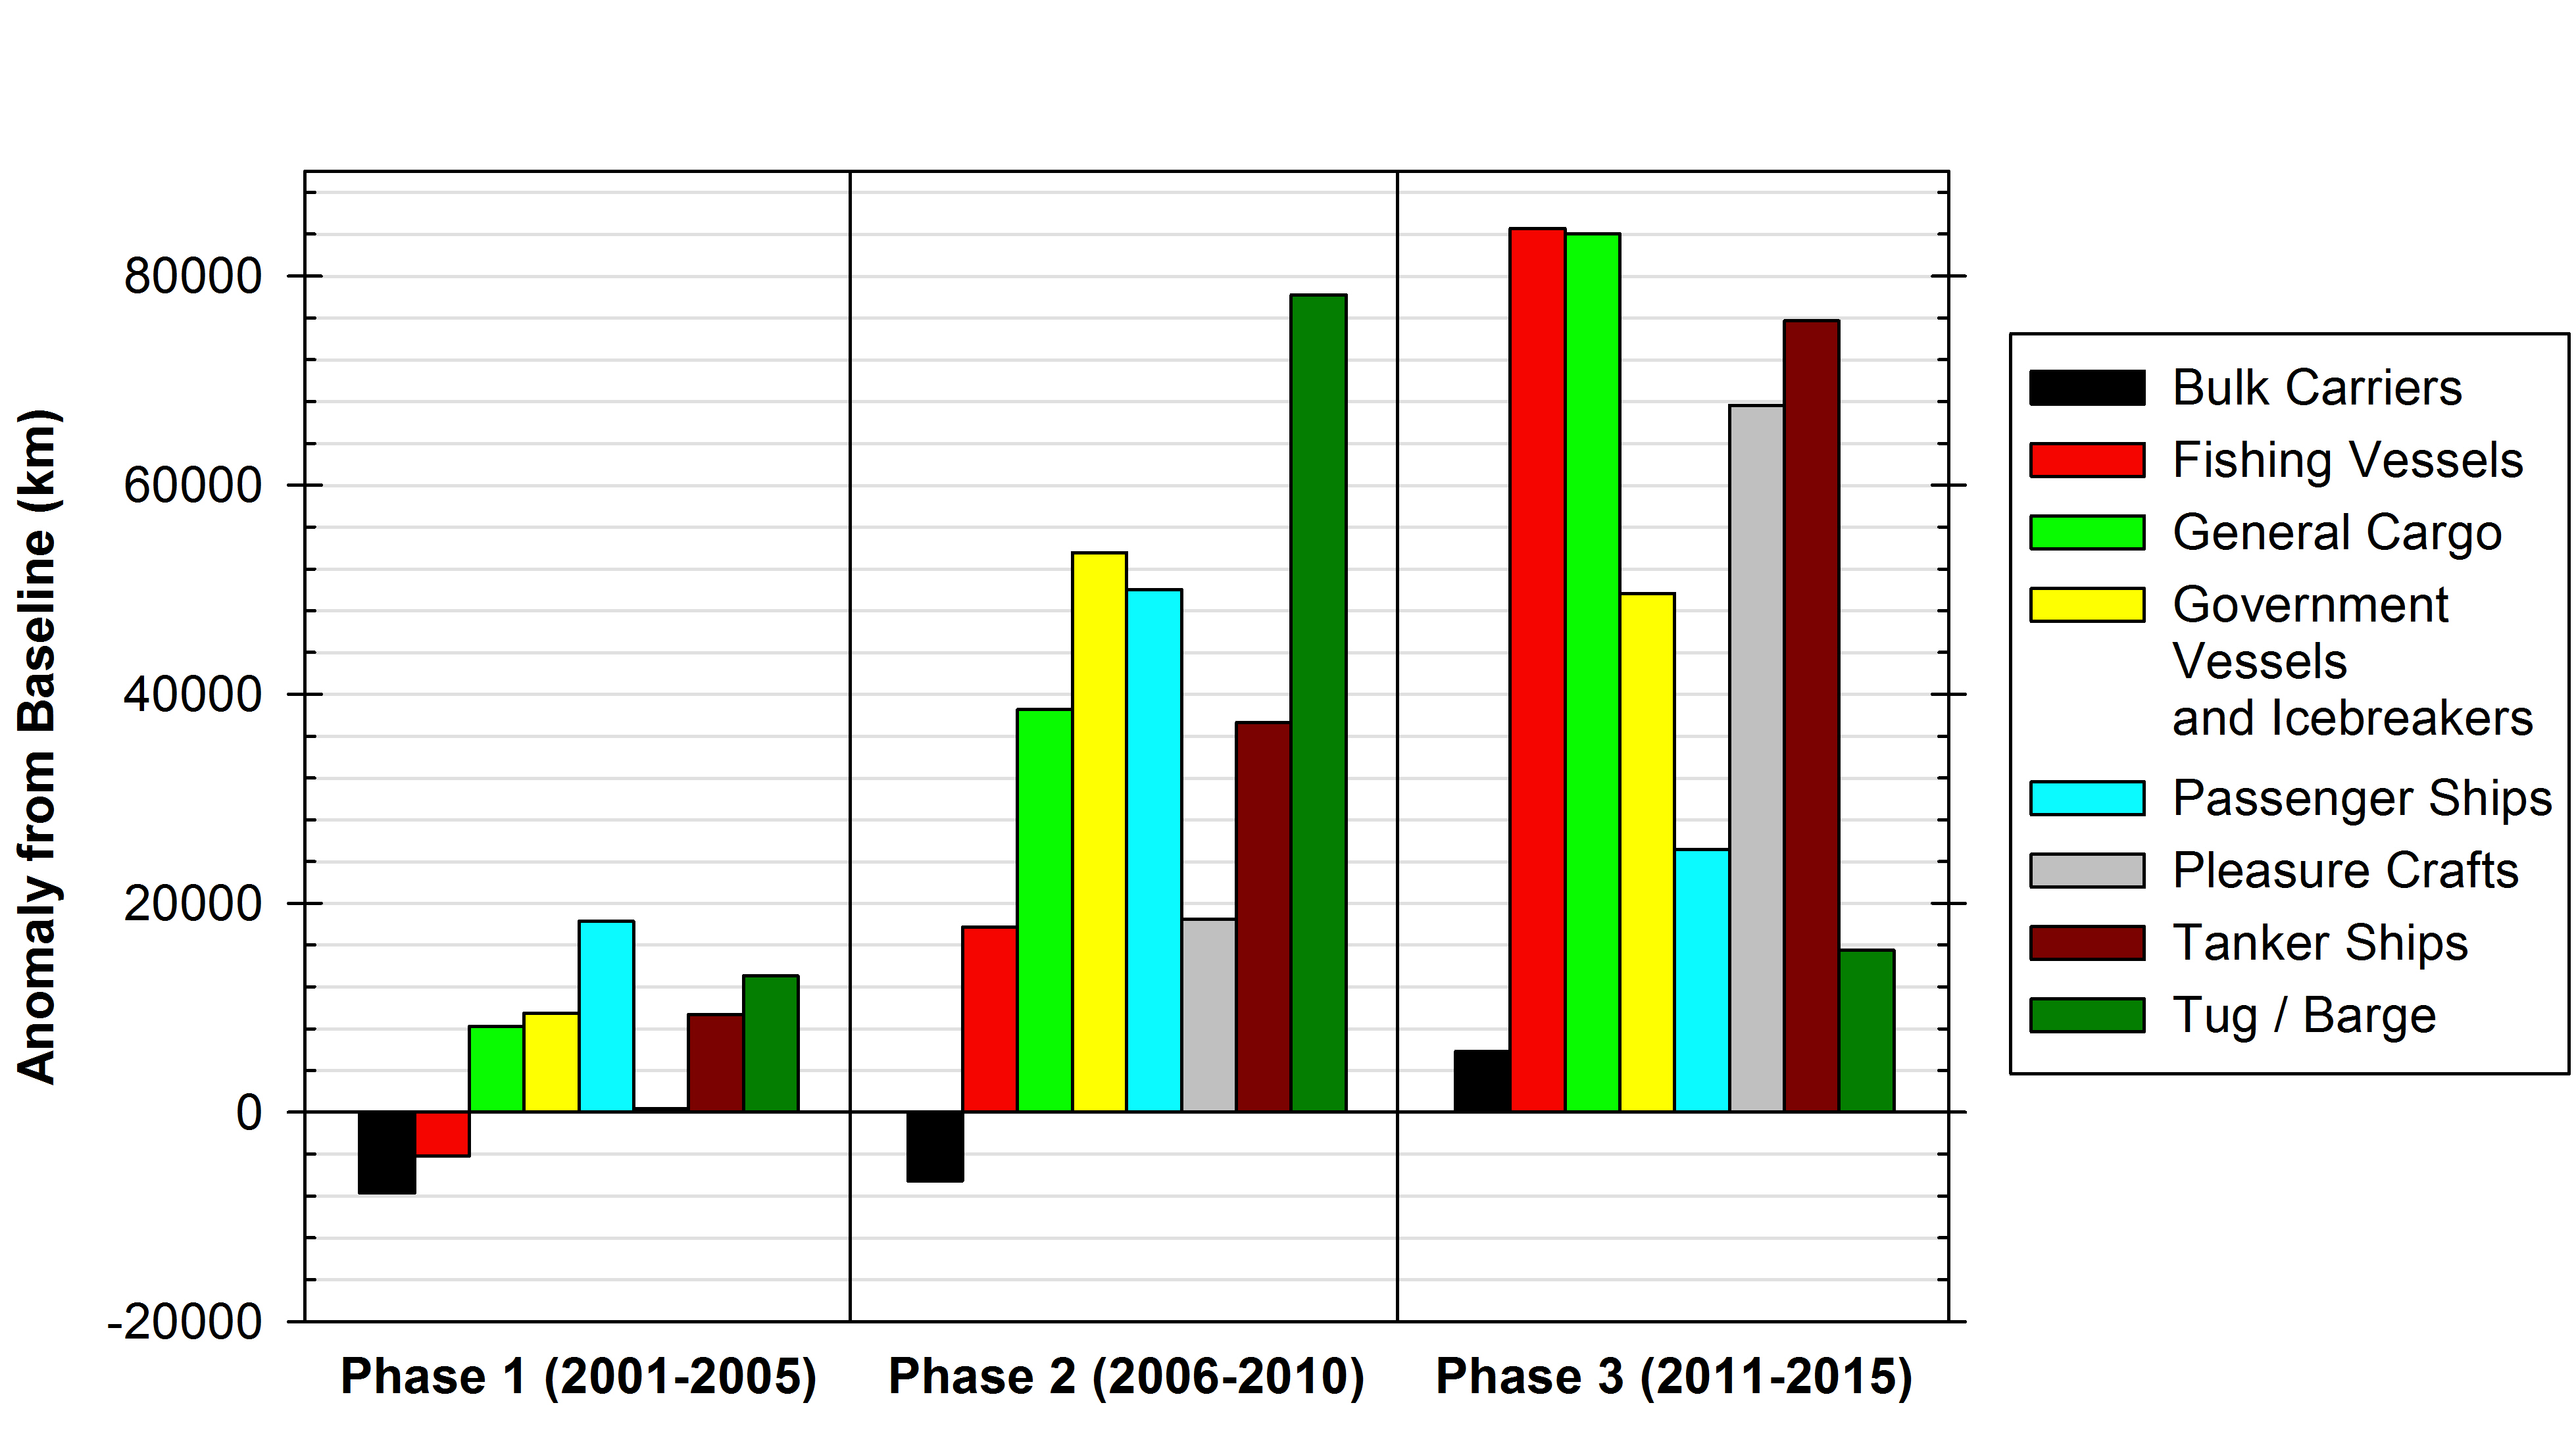
4. Change in Annual Travel
Change in Annual Average Kilometres Traveled per year from Baseline Period (1990-2000) to Phase 1, Phase 2 and Phase 3 by Vessel Type. (Published in Dawson et al. 2017 in Arctic)
5. Culturally Significant Marine Areas
Culturally Significant Marine Areas reflect Inuit and Northerners’ knowledge and extensive year-round use of important marine areas. They were identified by members of Arctic communities.

